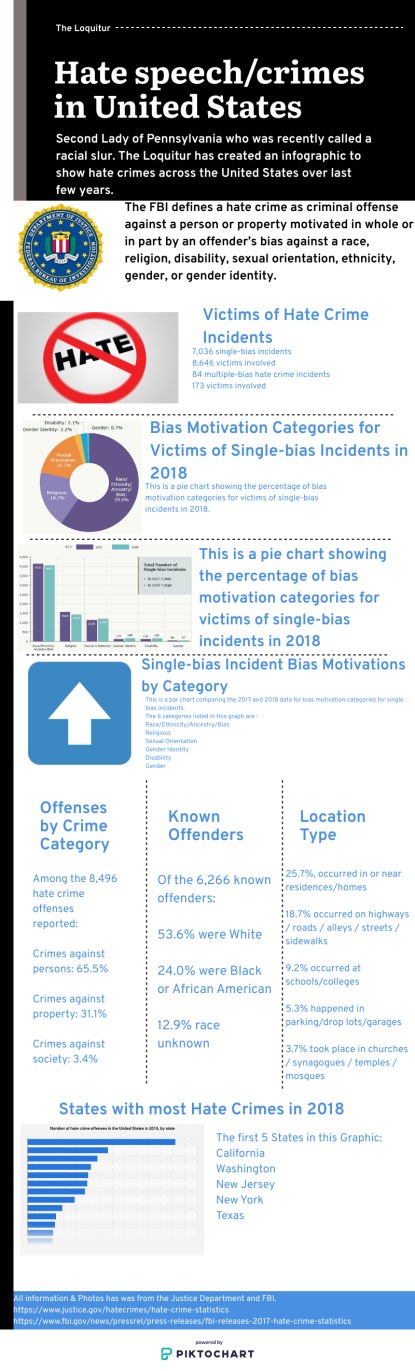
This infographic shows the definition of a hate crime and statistics about hate crimes in the United States over the last four years. The data on hate crimes in the United States come from the Justice department and FBI from the years 2016, 2017 and 2018. This infographic has two important graphs that breakdown motives from 2018 and the difference from 2017 hates crimes to 2018 hate crimes. This data shows a 17 percent jump in hate crimes from 2017 to 2016. The Loquitur wanted to create an infographic about hate crimes/speech, because the Second Lady of Pennsylvania was called a racial slur.